

EU ETS Q3 2026 Update
EUA prices have experienced significant growth over Q3 2026, as higher gas prices forced energy producers to partially switch back to coal, driving a stronger demand for CO2 emission allowances. In addition to this, as summer was historically hot, energy demand for cooling and air conditioning skyrocketed, leading to an increased demand for EUAs. This move has also been supported by a seasonal trend of buying before the 30th of September compliance deadline, with certain operators compensating their emissions on a ‘last-minute’ principle.
This upwards movement was also strengthened by existing European legislation requiring member states to increase their gas reserves to 90% before the winter season starts. This led to significant buying activity already, regardless of the high prices. What is more, the Iranian war is putting additional pressure on energy markets, as the Hormuz Strait remains closed and there seems to be no end to the conflict in sight. The current geopolitical context puts upward pressure on prices, in a market where demand is constant due to purchasing obligations on behalf of operators from EU member states.
As geopolitical tensions remain high and gas reserves low, there is a strong possibility that demand for gas remains stable, even at elevated prices. Since EUA prices move in tandem with Dutch TTF, there is a chance that we see a strong correlation between the two going forward and a continuation of their upward trajectory through Q3 2026, especially if temperatures stay abnormally high throughout September. On the other hand, high energy prices could lead to an economic slowdown, which could lower demand for CO2 emissions, potentially supporting a price stabilisation around current levels or even a slight price decrease.
From a technical perspective, we see that Dec26 prices have been range-bound throughout the second half of July and August, with stable volumes and reduced volatility. This follows a previous increase of 37.29% from 63.10 to 86.63 EUR. The price is currently trading around the upper end of the Bollinger Bands, with the MACD potentially showing a return to a positive trend. If prices move upwards, the 86.63 EUR level is a significant point of resistance, after which we can expect Dec26 prices to move as high as 93.60 EUR, their January 2026 peak. If the price moves downwards, 81.59 EUR acts a significant point of resistance which, if crossed, might trigger a movement towards the lower end of the Bollinger Bands first, ultimately leading to the 61.8% Fibonacci level at 77.64 EUR.
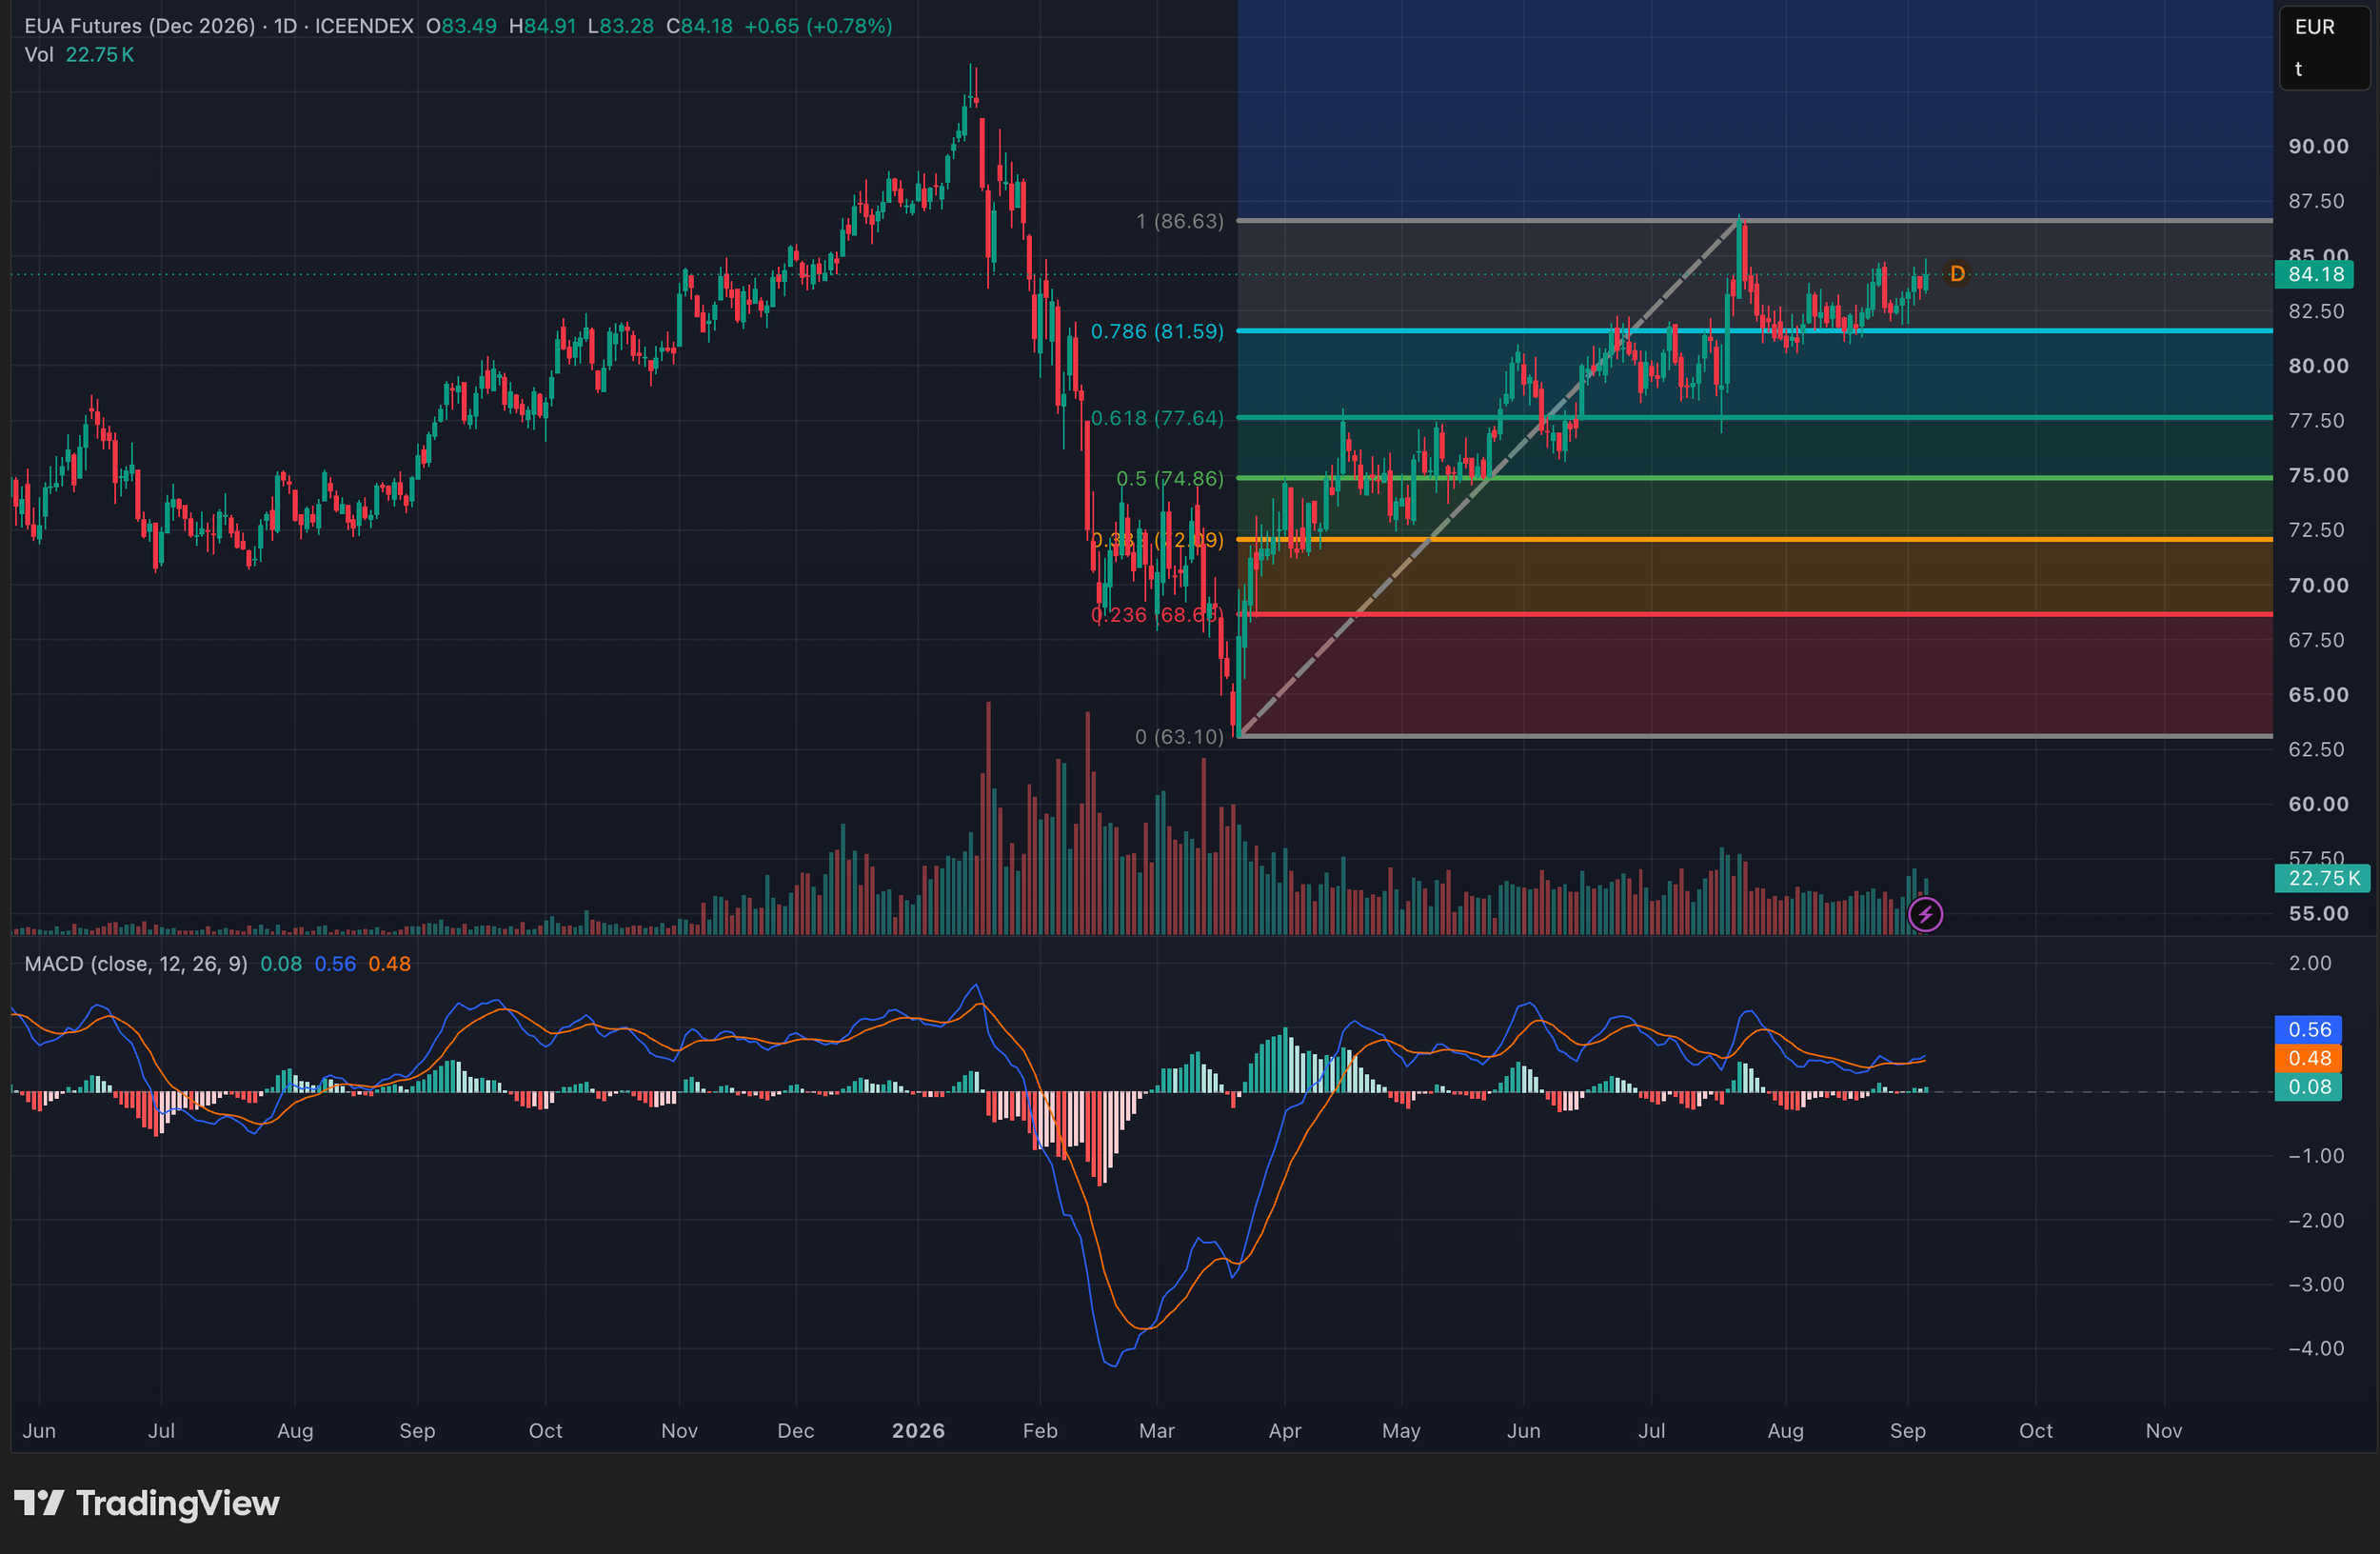
Fig.1 Techincal Analsis
